The Dashboard tab consists of three major sections you can work on:
Repricing
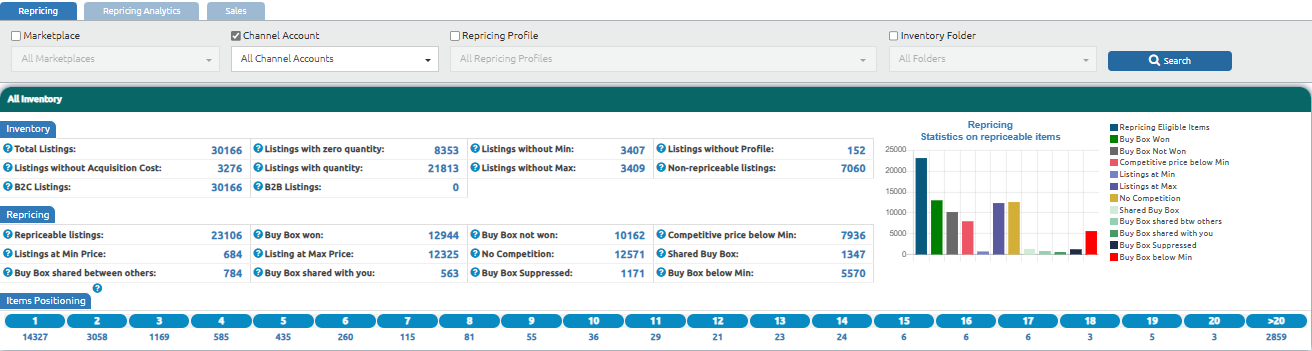
The Repricing section on the dashboard displays all marketplaces, available channel accounts, repricing profiles, and inventory folders. This section allows you to manage your selected marketplaces and control your entire inventory.
Inventory
This section provides an overview of your entire inventory, including:
Total Listings
Listings with Zero Quantity
Listings Without Minimum Price
Listings Without Maximum Price
Listings with quantity
Listings Without Acquisition Cost
Listings Without Profile
Non-Repriceable Listings
B2C Listings
B2B Listings
Repriceable Listings
This section displays the repricing history of all listings, including:
Repriceable listings
Buy Box Won
Buy Box Not Won
Competitive Price Below Min
Listings at Min Price
Listings at Max Price
No Competition
Shared Buy Box
Buy Box Shared Between Others
Buy Box Shared With You
Buy Box Suppressed
Buy Box Below Min
Item Position
Displays the position of repriceable items on Amazon.
Repricing Analytics
View insights related to repriceable items, Buy Boxes won, and repriced maximum and minimum values.
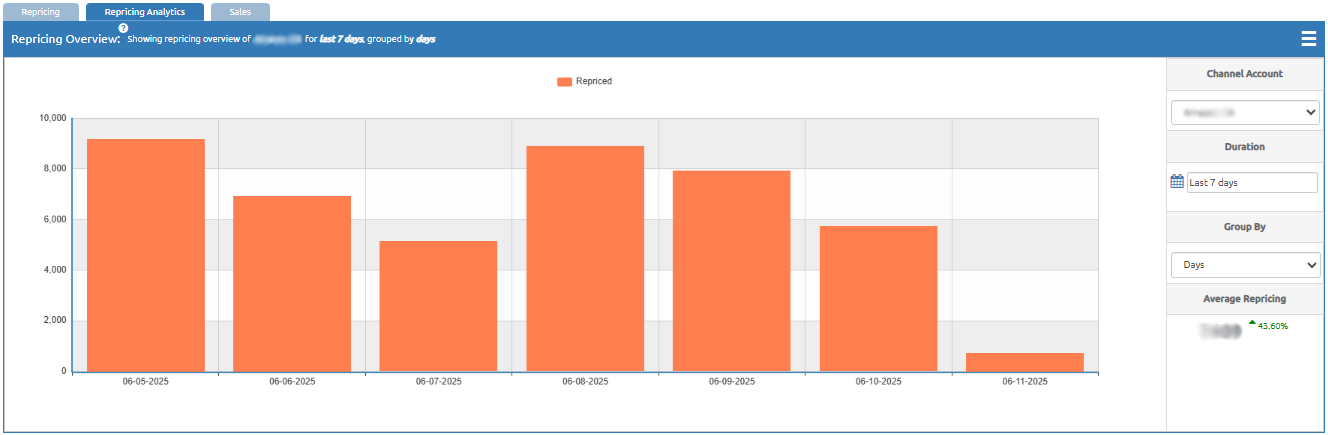
Repricing Overview
Shows the total number of listings repriced for the selected channel account and duration.
Average Repricing
Displays the average number of repricing events for a selected group, based on a defined period.
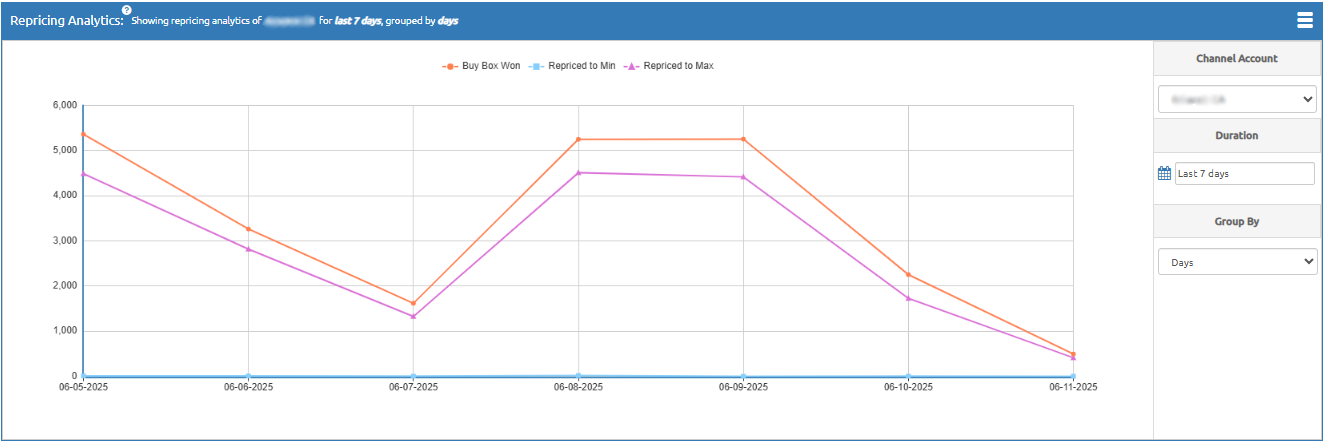
Repricing Trend Analysis
The Repricing Analytics section presents a 7-day trend analysis of each selected channel setup. You can choose the channel from the top-right section under “Channel Account” and then set the desired duration. It also displays the average repricing percentage of your channel.
Additionally, it shows:
Number of Buy Boxes Won
Minimum Repriced Value
Maximum Repriced Value
These analytical visuals make it easier to interpret repricing performance and identify trends that support your business growth.
Sales
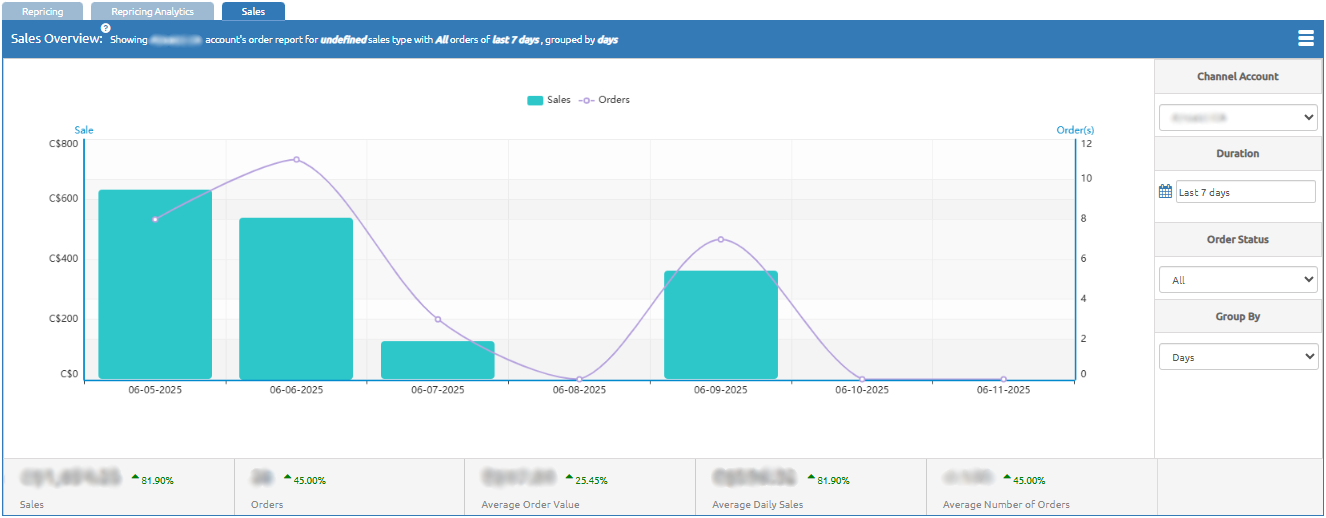
This section allows you to review your sales performance after repricing your inventory. It includes three types of analytics:
Sales Overview
Displays sales data for the selected channel account, order status, duration and group by days,months and years.
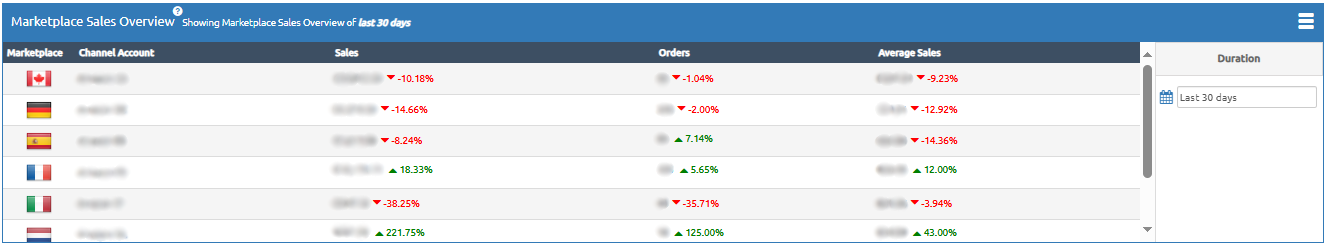
Marketplace Sales Overview
Provides a summary of sales, order volume, and average sales across all added marketplaces. You can filter this data based on duration.
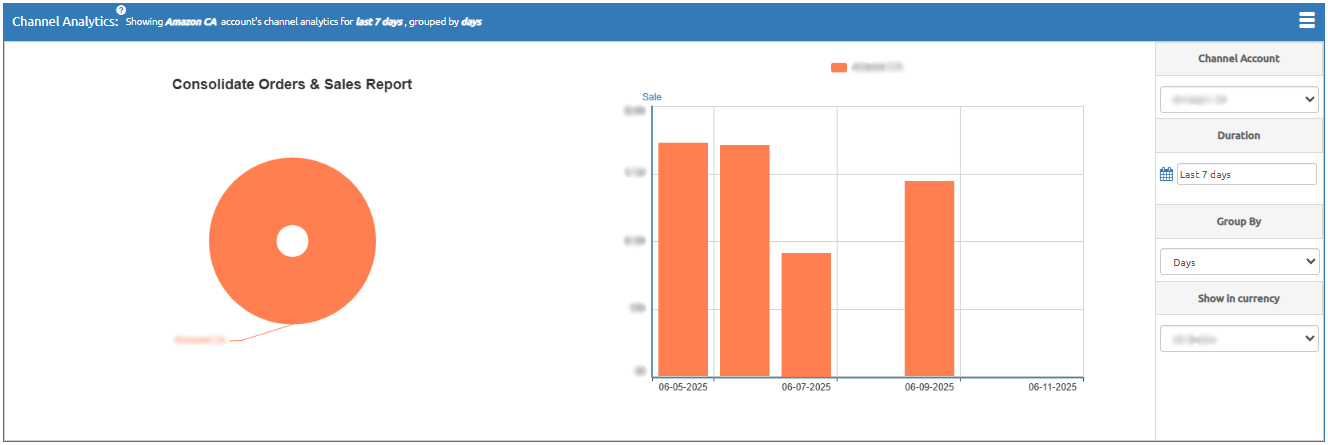
Channel Analytics
Shows consolidated order and sales reports across all marketplaces, filtered by: